

Click to play tutorial.Welcome to the Making the Trade Checklist Page!

You have a stock you want to buy. You have the MAF Oscillator Indicators of the current market. You have the MAF Stock Rating of the market sector your stock belongs to. You have the MAF Stock Rating of your stock and the UTS$ or DTR$ price. Are you ready to pull the trigger? The answer is NO!
Before you pull the trigger you need to decide if you're making an investment or a trade. You make an investment if you have information about the company that says the company has potential growth of sales, revenue and market share of their products. An investment has a timeline of 1 year or more. You make a trade if you have information about a company that is a short term catalyst that will move the stock price up or down. A trade has a timeline of minutes to less than 1 year.
Investing and trading in the stock market involves risk and can result in the loss of your money. Risk is defined as what you don't know about the company, your fellow shareholders and the stock analyst community. Fortunately you have trading tools at MAFTRADER.com that provide insight as to how the investment community supports or doesn't support a stock. Being an investor or trader is like being a pilot. Pilots inspect their aircraft before boarding it. Pilots perform a preflight check list before takeoff. While flying the plane a pilot monitors the instrument panel to know the status of systems in the airplane and the movement of the airplane in the air. You must do the same when investing or trading to minimize the risk of what you can see and what you don't know. That being said let's begin the pre-investment/pre-trade check list.
Stock Selection
Scan the Free MAF Stock Ratings found of the Free MAF Data page of this website for stocks that have a MAF Stock Rating of
 ,
,
 or
or
 .
.
Know the Company
At minimum you must read the company profile to learn what the company does to make money. Company profiles can be found at the company's website, your stock brokerage website, https://finance.yahoo.com, https://www.marketwatch.com and many more financial websites. The next thing you want to inspect is the company financial profile. Of key interest are the following company financial metrics that you can use to compare different companies financial performance:
- Price-to-Earnings Ratio(PE): The ratio for valuing a company derived by dividing the current share price by the company’s per-share earnings (EPS). P/E ratios are used by investors and analysts to determine the relative value of a company's shares in an apples-to-apples comparison against other companies. It can also be used to compare a company against its own historical record or to compare aggregate markets against one another or over time.
- Earnings Per Share: Earnings per share (EPS) is the portion of a company’s profit allocated to each share of common stock. Earnings per share surrounded by Parenthesis () or preceded by a minus sign indicate an earnings per share loss. Earnings per share should be positive.
- Current Ratio: The current ratio is a financial ratio that measures whether or not a firm has enough resources to pay its debts over the next 12 months. A current Ratio of 1.0 or higher is preferred.
- Quick Ratio: The quick ratio is an indicator of a company’s short-term liquidity position and measures a company’s ability to meet its short-term, (Within 90 days), obligations with its most liquid assets. A quick ratio of 1.0 or higher is preferred.
- Debt Equity Ratio: Debt-to-equity (D/E) ratio is used to evaluate a company’s financial leverage and is calculated by dividing a company’s total liabilities by its shareholder equity. D/E ratio is an important metric in corporate finance. It is a measure of the degree to which a company is financing its operations with debt rather than its own resources.
- Long-Term Debt Equity Ratio: The Long Term Debt to Equity Ratio is a measure of a company's financial leverage. It is calculated as Long Term Debt divided by Equity. This is measured using the most recent balance sheet available, whether interim or end of year. The greater a company's leverage, the higher the ratio. Generally, companies with higher Debt to Equity ratios are thought to be more risky.
- Cash Ratio: The cash ratio is the ratio of a company’s total cash and cash equivalents to its current liabilities. The cash ratio is a measure of a company's ability to repay its short-term debt with readily-liquidated cash resources. A cash ratio of 1.0 or higher is preferred.
- Return On Assets: Return on assets (ROA) refers to a financial ratio that indicates how profitable a company is in relation to its total assets. You can calculate a company's ROA by dividing its net income by its total assets. Corporate management, analysts, and investors can use ROA to determine how efficiently a company uses its assets to generate a profit. The metric is commonly expressed as a percentage by using a company's net income and its average assets. A higher ROA means a company is more efficient and productive at managing its balance sheet to generate profits while a lower ROA indicates there is room for improvement.
- Return On Equity: Return On Equity (ROE) is a measure of financial performance calculated by dividing net income by shareholders’ equity. Because shareholders’ equity is equal to a company’s assets minus its debt, ROE is considered the return on net assets. ROE is considered a gauge of a corporation's profitability and how efficient it is in generating profits. The higher the ROE, the more efficient a company's management is at generating income and growth from its equity financing.
- Return On Investment: Return on investment (ROI) is a performance measure used to evaluate the efficiency or profitability of an investment or compare the efficiency of a number of different investments. ROI tries to directly measure the amount of return on a particular investment, relative to the investment’s cost. The benefit (or return) of an investment is divided by the cost of the investment. The result is expressed as a percentage or a ratio.
- Gross Margin: The term gross margin refers to a profitability measure that looks at a company's gross profit compared to its revenue or sales. A company's gross margin is expressed as a percentage. Gross profit is determined by calculating gross sales. The higher the gross margin, the more capital a company retains, which it can then use to pay other costs or satisfy debt obligations. The revenue or sales figure is gross revenue or sales, less the cost of goods sold (COGS), which includes returns, allowances, and discounts.
- Operating Margin: The operating margin measures how much profit a company makes on a dollar of sales after paying for variable costs of production, such as wages and raw materials, but before paying interest or tax. It is calculated by dividing a company’s operating income by its net sales. Higher ratios are generally better, illustrating the company is efficient in its operations and is good at turning sales into profits.
- Profit Margin: Profit margin is a common measure of the degree to which a company or a particular business activity makes money. Expressed as a percentage, it represents the portion of a company’s sales revenue that it gets to keep as a profit, after subtracting all of its costs. For example, if a company reports that it achieved a 35% profit margin during the last quarter, it means that it netted $0.35 from each dollar of sales generated.
- Sales Quarter Over Quarter (ttm): Sales Quarter Over Quarter Trailing 12 months (TTM) is a term used to describe the past 12 consecutive months of a company’s sales performance data, that’s used for reporting financial figures. The 12 months studied do not necessarily coincide with a fiscal-year ending period.
These company financial metrics are the minimum that can be used to evaluate a company and access risk. Some companies are given a pass on these metrics based on the forecast of higher profits in the future. Companies in this situation are more risky to invest in.
To save you time maftrader.com provides a summary table that groups these financial metrics by category and displays a score derived from our proprietary algorithms. Go to our Free MAF Stock Fundamentals Page coming soon to review the fundamental scores of your stocks.
Review the Company’s Stock Chart
A review of a company’s stock chart is required. This review is of the stock chart is called technical analysis. The amount of information available about stock chart technical analysis can fill a book. If you want to learn about stock chart technical analysis, check out stockcharts.com. For this topic we will stick to the basics of support and resistance.
- Support: is the price below the current stock price that a stock can fall to where the stock price performed a bullish reversal or traded sideways for a period of time in the past.
- Resistance: is the price above the current stock price that a stock can rise to where the stock price performed a bearish reversal or traded sideways for a period of time in the past.
, Extremely Oversold.
The horizontal annotated red lines represent resistance price levels on the stock chart because they occur above the current stock price. When a stock moves above a line of resistance it can be
assumed that the stock can rise to the next highest resistance price. The horizontal annotated blue line represents the support price level on the stock chart because it occurred below the current stock price.
When a stock moves below a line of support, it can be assumed that the stock can fall to the next lowest support price. It is also very useful to look at longer timeline charts to see if higher and lower support
and resistance price levels can be drawn. For example, start with a 6 month chart followed by: 1 year, 5 years, 10 years etc.
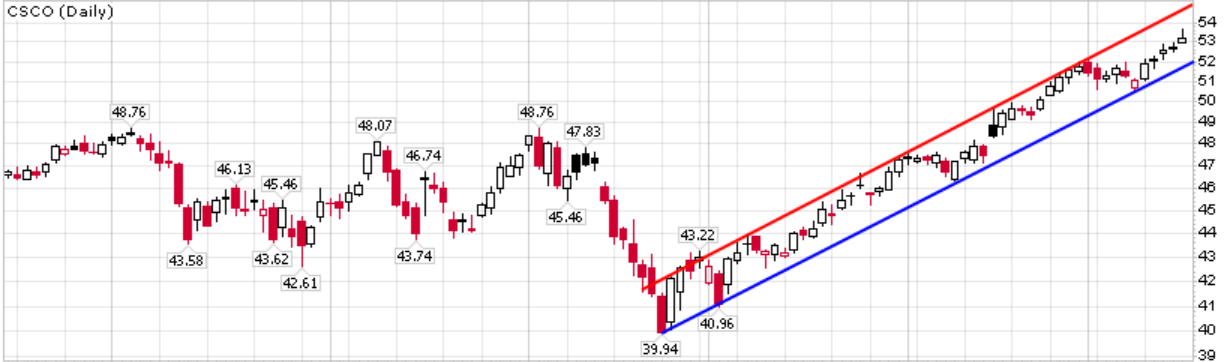
NIO stock has been in a trading range called a channel The lower channel line is the blue support line on the NIO Chart. The upper channel line is the red resistance line at $8.21. Channel lines on a stock chart are parallel lines that can also occur at different angles on stock charts. The same rules of support apply to lower channel lines and resistance to upper channel lines whether the channel lines are horizontal or occur at an angle on the stock chart. The CSCO stock chart below shows an example of a rising channel.

Stock Chart Patterns and Price Target Predictions
Stock chart patterns can be a very useful tool that can be used to predict where a stock price will go to in the future. Stockcharts.com has examples of stock chart patterns that you can compare to your stock to determine which chart pattern is forming on the stock chart of the company you're investing or trading. It is also very useful to look at longer timeline charts to see if larger stock chart patterns are developing. For example, start with a 6 month chart followed by: 1 year, 5 years, 10 years etc. Stock chart patterns are divided into 2 categories, Reversal Patterns and Continuation Patterns. Reversal patterns are patterns where a bullish up trending stock reverses direction to a bearish downtrend direction or a bearish down trending stock reverses direction to a bullish uptrend direction. Continuation patterns continue the current trend of the stock. Placing all the stock chart patterns on a cheat sheet will allow you to find the stock pattern that may be forming for your stock in a reasonable amount of time. Note: These stock chart patterns can also be seen on intraday stock charts.
Reversal Patterns
- Double Top Reversal
- Double Bottom Reversal
- Head and Shoulders Top
- Head and Shoulders Bottom
- Falling Wedge
- Rising Wedge
- Rounding Bottom
- Triple Top Reversal
- Triple Bottom Reversal
- Bump and Run Reversal
Continuation Patterns
- Flag, Pennant
- Symmetrical Triangle
- Ascending Triangle
- Descending Triangle
- Rectangle
- Price Channel
- Measured Move - Bullish
- Measured Move - Bearish
- Cup with Handle
News and Company Press Releases
News and company press releases are a source of risk to your money. News and company press releases should be read on a daily basis to keep you up to date concerning information about the company you're invested in and the market place as a whole. Good news or bad news about a company that is in the same sector as the company you're invested in or news directly about the company you're invested in can affect the price of your stock.
Investment or Trade
Based on the information you have read and reviewed you're ready to decide if you want to invest or trade the stock of the company. Once you decide to invest in or trade the stock you're ready to pull the trigger and buy the stock.
Pre-trade Check List
Let's review what you have completed at this time.
- MAF Oscillator Market Indicators
- Market Sector MAF Stock Rating
- Stock with MAF Stock Rating of
,
or
, noting UTS$/DTR$
- Company Profile
- Current Ratio
- Quick Ratio
- Cash Ratio
- Earnings Per Share
- Price-to-Earnings Ratio(PE)
- Stock Chart Support and Resistance
- Stock Chart Channel Lines
- Stock Chart Patterns
- News and Company Press Releases
- Hidden and Unpredictable Risk
- Investment or Trade
Now you're ready to pull the trigger and submit your stock buy order. Your buy order should be a limit order, (All or None). This will insure that your order is executed at your price or lower and all the shares of the buy order are purchased at one price. After your buy order is executed you should submit a Sell Stop Market Order or a Sell Stop-Limit Order at an activation price that is 4% below the price of your executed buy order. This will limit your loss if things don't go as expected. After the stock rises 3% above the price of your executed buy order, you should move your Sell Stop Market Order or Sell Stop-Limit Order above the executed buy order price to a price that covers your round trip trading commission fees. On the second day you're in a stock and thereafter, you should place your Sell Stop Market or Sell Stop-Limit order 2% or 3% below the daily updated UTS$ price of your stock that is found on the Free MAF Data page of this website.
Investment and Trade Management
Daily management of your investments and trades is required. Your stock portfolio should only contain a number of stocks that can be managed in the time you decide to allocate to this endeavor. MAFTRADER.com makes it easy to manage your stock portfolio. Reading the MAF Oscillator Market Indicators, Market Sector MAF Stock Rating and MAF Stock Rating of your stock takes just seconds to read and comprehend. Preparing Stock Chart Support and Resistance and Stock Chart Channel Lines can be drawn in minutes. Stock Chart Patterns can also be completed in minutes if you're familiar with stock chart patterns. Placing all the stock chart patterns on a cheat sheet will allow you to find the stock pattern that may be forming for your stock in a reasonable amount of time. Note: Stock chart patterns can also be seen on intraday stock charts.
Remember to stick with your investment or trading plan as long as the thesis for buying the stock hasn't changed. Follow the Investor Action and Trader Action of the MAF Stock Rating for your stock based on your individual risk tolerance. MAF Stock Ratings support
all investment styles for buying stocks. For example, some investors like to maximize gains and buy stocks with a MAF Stock Rating of
(Extremely Oversold) when the stock price is below a FMA(ISROES) rating below OS4 or rises above the daily DTR$. Another investor might wait to buy the stock once the stock rises to a MAF Stock Rating of
 (Confirmed Normal Uptrend).
MAF Stock Ratings support all investment styles for selling stocks. For example, some investors
like to maximize gains and sell stocks with a MAF Stock Rating of  (Extremely Overbought) when the stock price is above a FMA(ISROES) rating above OB4 or the stock price falls below the daily UTS$. Another investor might wait to sell the stock once the stock falls to a MAF Stock Rating of
 (Confirmed Downtrend).
MAF Stock Ratings allow you to invest and trade in accordance to your individual trading style and risk tolerance. Review the following trade management check list items after each daily stock market close to manage your investments and trades.
- MAF Oscillator Market Indicators
- Market Sector MAF Stock Rating
- Stock MAF Stock Rating
- Stock Chart Support and Resistance
- Stock Chart Channel Lines
- Stock Chart Patterns
- News and Company Press Releases
- Hidden and Unpredictable Risk
- Update stop loss order
Disclaimer
The opinions and information provided herein are intended to inform and are provided "as is" for informational purposes only. The information provided herein does not constitute a solicitation to buy or sell a security. The information provided herein is derived from a proprietary computer stock analysis algorithm and comes with no warranty of any kind. Should you choose to interpret the information provided by MAFTRADER.com as investment advice, you do so at your own risk and you assume total liability for any and all damages and loss. Trading and investing is a high risk activity that can result in the entire loss of your money. You should consult a licensed investment professional regarding any information provided herein and for investment advice. Should you choose to follow or use this information, MAFTRADER.com here by discloses that staff, members of the staff's families, and/or entities, with which they are affiliated, may from time to time, buy, sell or hold stock of the companies that appear on the MAFTRADER.com web site. The information contained on the MAFTRADER.com web site is drawn from sources believed to be factual and reliable, but in no way does MAFTRADER.com represent or guarantee the accuracy or completeness thereof, nor in providing it, does MAFTRADER.com assume any liability. The information is provided as of the date appearing on the MAFTRADER.com web site and MAFTRADER.com assumes no obligation to update the information or advice on further developments relating to any named securities. The information found on the MAFTRADER.com web site is protected by the trademark and copyright laws of the United States and may not be copied, or reproduced in any manner without the expressed, written consent of MAFTRADER.com.